
Today we will run through one way of estimating the intrinsic value of Limelight Networks, Inc. (NASDAQ:LLNW) by estimating the company’s future cash flows and discounting them to their present value. The Discounted Cash Flow (DCF) model is the tool we will apply to do this. Models like these may appear beyond the comprehension of a lay person, but they’re fairly easy to follow.
Remember though, that there are many ways to estimate a company’s value, and a DCF is just one method. For those who are keen learners of equity analysis, the Simply Wall St analysis model here may be something of interest to you.
View our latest analysis for Limelight Networks
The calculation
We are going to use a two-stage DCF model, which, as the name states, takes into account two stages of growth. The first stage is generally a higher growth period which levels off heading towards the terminal value, captured in the second ‘steady growth’ period. To start off with, we need to estimate the next ten years of cash flows. Where possible we use analyst estimates, but when these aren’t available we extrapolate the previous free cash flow (FCF) from the last estimate or reported value. We assume companies with shrinking free cash flow will slow their rate of shrinkage, and that companies with growing free cash flow will see their growth rate slow, over this period. We do this to reflect that growth tends to slow more in the early years than it does in later years.
A DCF is all about the idea that a dollar in the future is less valuable than a dollar today, and so the sum of these future cash flows is then discounted to today’s value:
10-year free cash flow (FCF) forecast
| 2021 | 2022 | 2023 | 2024 | 2025 | 2026 | 2027 | 2028 | 2029 | 2030 | |
| Levered FCF ($, Millions) | US$9.63m | US$22.2m | US$32.1m | US$46.6m | US$58.0m | US$68.3m | US$77.2m | US$84.8m | US$91.2m | US$96.6m |
| Growth Rate Estimate Source | Analyst x3 | Analyst x1 | Analyst x1 | Analyst x1 | Est @ 24.4% | Est @ 17.75% | Est @ 13.09% | Est @ 9.83% | Est @ 7.55% | Est @ 5.95% |
| Present Value ($, Millions) Discounted @ 8.5% | US$8.9 | US$18.9 | US$25.1 | US$33.7 | US$38.6 | US$41.9 | US$43.7 | US$44.3 | US$43.9 | US$42.9 |
(“Est” = FCF growth rate estimated by Simply Wall St)
Present Value of 10-year Cash Flow (PVCF) = US$341m
We now need to calculate the Terminal Value, which accounts for all the future cash flows after this ten year period. For a number of reasons a very conservative growth rate is used that cannot exceed that of a country’s GDP growth. In this case we have used the 5-year average of the 10-year government bond yield (2.2%) to estimate future growth. In the same way as with the 10-year ‘growth’ period, we discount future cash flows to today’s value, using a cost of equity of 8.5%.
Terminal Value (TV)= FCF2030 × (1 + g) ÷ (r – g) = US$97m× (1 + 2.2%) ÷ (8.5%– 2.2%) = US$1.6b
Present Value of Terminal Value (PVTV)= TV / (1 + r)10= US$1.6b÷ ( 1 + 8.5%)10= US$703m
The total value is the sum of cash flows for the next ten years plus the discounted terminal value, which results in the Total Equity Value, which in this case is US$1.0b. To get the intrinsic value per share, we divide this by the total number of shares outstanding. Compared to the current share price of US$7.7, the company appears about fair value at a 12% discount to where the stock price trades currently. The assumptions in any calculation have a big impact on the valuation, so it is better to view this as a rough estimate, not precise down to the last cent.

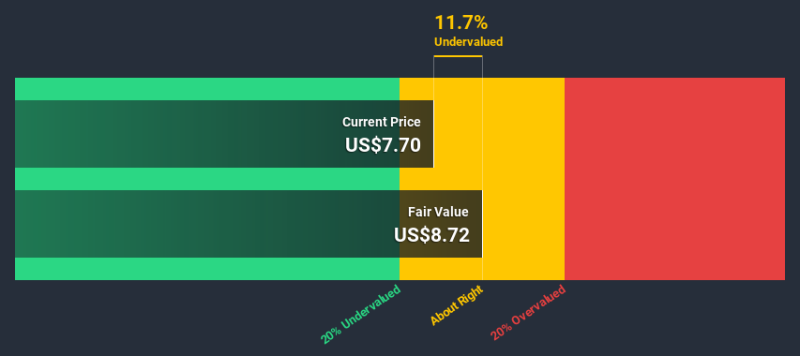
NasdaqGS:LLNW Discounted Cash Flow July 11th 2020
The assumptions
We would point out that the most important inputs to a discounted cash flow are the discount rate and of course the actual cash flows. Part of investing is coming up with your own evaluation of a company’s future performance, so try the calculation yourself and check your own assumptions. The DCF also does not consider the possible cyclicality of an industry, or a company’s future capital requirements, so it does not give a full picture of a company’s potential performance. Given that we are looking at Limelight Networks as potential shareholders, the cost of equity is used as the discount rate, rather than the cost of capital (or weighted average cost of capital, WACC) which accounts for debt. In this calculation we’ve used 8.5%, which is based on a levered beta of 1.038. Beta is a measure of a stock’s volatility, compared to the market as a whole. We get our beta from the industry average beta of globally comparable companies, with an imposed limit between 0.8 and 2.0, which is a reasonable range for a stable business.
Moving On:
Whilst important, the DCF calculation is only one of many factors that you need to assess for a company. The DCF model is not a perfect stock valuation tool. Rather it should be seen as a guide to “what assumptions need to be true for this stock to be under/overvalued?” For example, changes in the company’s cost of equity or the risk free rate can significantly impact the valuation. For Limelight Networks, we’ve compiled three fundamental aspects you should explore:
- Risks: For example, we’ve discovered 3 warning signs for Limelight Networks that you should be aware of before investing here.
- Future Earnings: How does LLNW’s growth rate compare to its peers and the wider market? Dig deeper into the analyst consensus number for the upcoming years by interacting with our free analyst growth expectation chart.
- Other Solid Businesses: Low debt, high returns on equity and good past performance are fundamental to a strong business. Why not explore our interactive list of stocks with solid business fundamentals to see if there are other companies you may not have considered!
PS. The Simply Wall St app conducts a discounted cash flow valuation for every stock on the NASDAQGS every day. If you want to find the calculation for other stocks just search here.
This article by Simply Wall St is general in nature. It does not constitute a recommendation to buy or sell any stock, and does not take account of your objectives, or your financial situation. We aim to bring you long-term focused analysis driven by fundamental data. Note that our analysis may not factor in the latest price-sensitive company announcements or qualitative material. Simply Wall St has no position in any stocks mentioned.
Have feedback on this article? Concerned about the content? Get in touch with us directly. Alternatively, email [email protected].


More Stories
Sportswear: Lolle acquires Louis Garneau Sports
REM is still innovative enough to foot the bill
A trip to the restaurant with no regrets for these customers